I’ve written previously about exploring the relationship between user needs and defining strategy.
At the time I was working through a specific project – but the thought around how strategy has different ‘paces’ depending on the layer of the organisation has stayed with me. Connected to this is how we factor in ‘user needs’ to the process.
Why Pace layers?
Wise words from Sophie pointed out the difference in a strategy at a team vs an organisational level is a big factor in how they incorporate user needs. At a high level ‘meet user needs’ might be an appropriate strategy, but at a detail level you need to be much more specific about which of those needs you’re meeting.
Pace layers immediately came to mind as a model that reflected something similar – ultimately the way different levels of abstraction respond to inputs and change over time. Some slower than others.
Armed with that thought, I sketched out how I thought it could look:
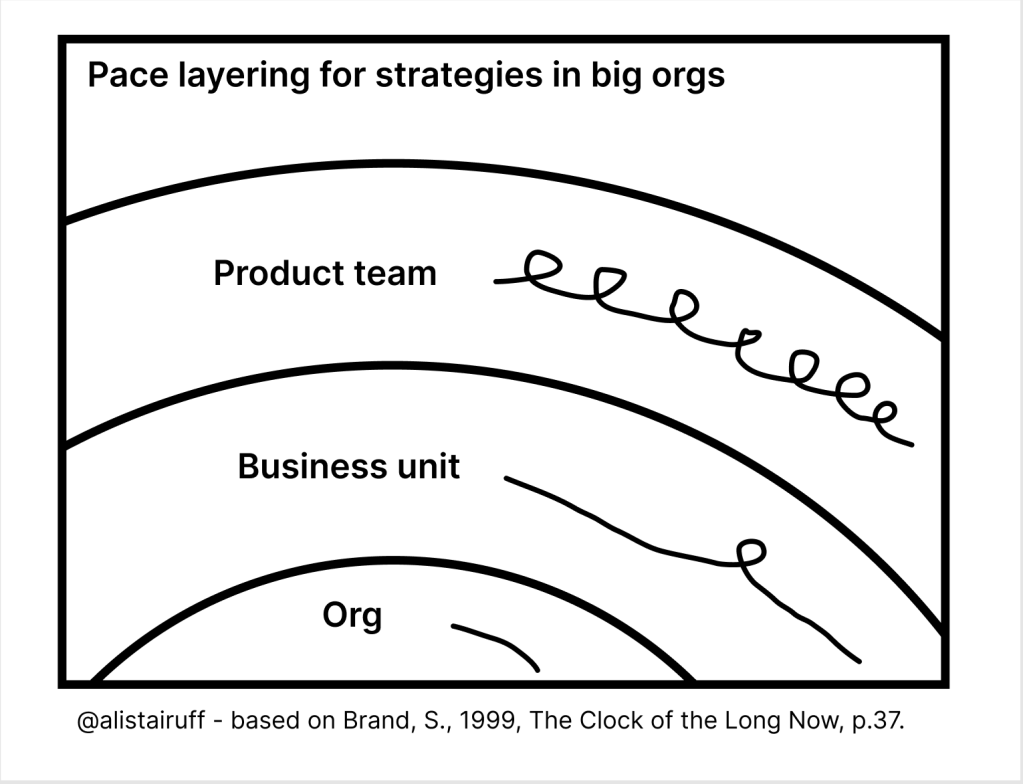
The visual shows how a strategy set at a product team level can change (realtively) quickly, based on learning new information.
As you move up the layers in the org, to a business unit, that strategy should be slower to chane, with ultimately the organisation as a whole have the slowest changing strategy.
Aspects of Strategy, rather than team size
More time sitting with this idea, especially pondering how user needs and other research inputs related to it shifted my focus.
Increasingly I was more aware that actually each scale of team in my initial attempt (product team, business unit and org) all had aspects of strategy that would change at different speeds. So I put an updated version out on twitter and welcomed comments.
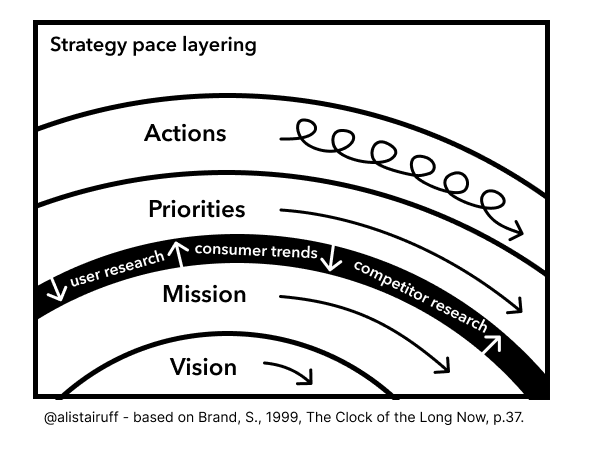
Instead of the abstraction levels always being related to the organisation structure, it made more sense to organise it using the different aspects (or layers I guess) that you might find in a strategy.
I’m drawing on a structure that I’ve used before – it is probably drawn from a range of different sources which I should pull out and reference but it loosely breaks down to:
- Vision – Longer term aspirational position
- Mission – The direction of travel you’ll go to achieve that position
- Priorities – The things you should focus on to move you along that direction of travel
- Actions – The first step of each of those priorities that could start tomorrow.
As I hinted at, I was still keen to weave in some for of user needs to the visual. Initially I included research inputs (user research, consumer trends and competitor research – very much not intended to be an exhaustive list) through the middle. The idea being that the inputs influenced the layers above (priorities) and below (mission) them the most.
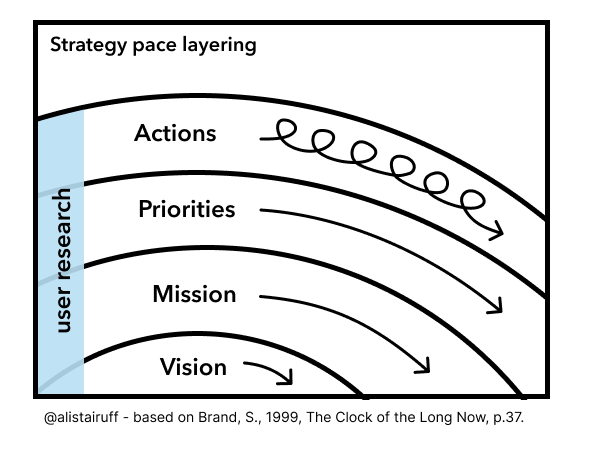
I still think there’s some validity to this idea, that the research inputs are primarily driving decision making at these two layers. However, they of course filter down and up to the other layers and I was keen to visualise that research was not limited in my view to only this middle set of layers. So I tweaked it again…
It’s hardly groundbreaking, but I present to you my updated ‘Strategy pace layering x user needs’ diagram. Looking at this again, I think it’s lost something by only having user research as a research input example. Don’t get me wrong, I very much believe in user research as an input that can shape strategy, I just think that others are complementary and so probably should be reflected still.
There’s probably a whole essay on research’s role at each layer of strategy to be written, but suffice to say you’ll want to tailor your research to whatever layer you’re thinking about. As with all good frameworks, it’s not so much having a step by step process for each layer, and more collectively recognising which layer your research relates to, and using that to shape research questions and analysis.
To be honest, even if I wrote it up, I’d be surprised if it looked much different to something like Emma Boulton’s Research Funnel you can see applied by people already.


Leave a comment